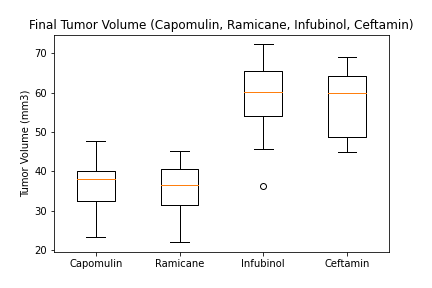
Above are four boxplots comparing the final tumor volume for drug regimens Capomulin, Ramicane, Infubinol, and Ceftamin.
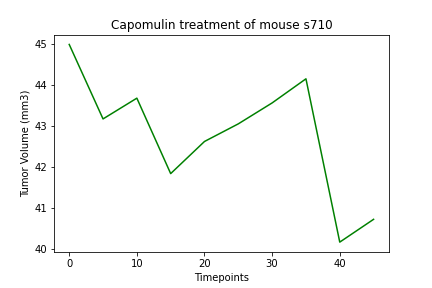
Above is an example of one mouse's tumor volume over the course of treatment.
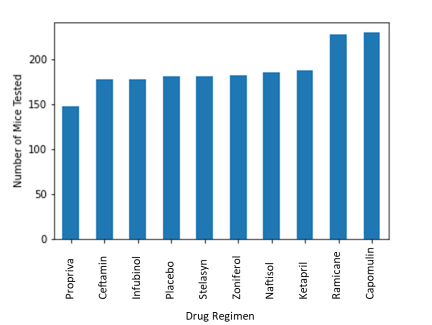
Above are the number of mice in each drug regimen group
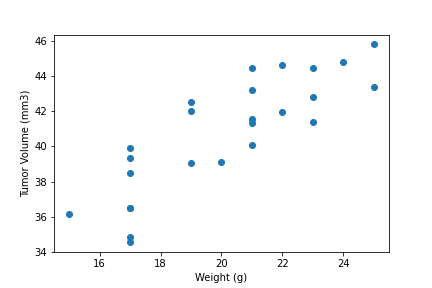
Above is a scatter plot showing weight vs Tumor Volume. To view the linear regression, click on the picture or use the navbar above.