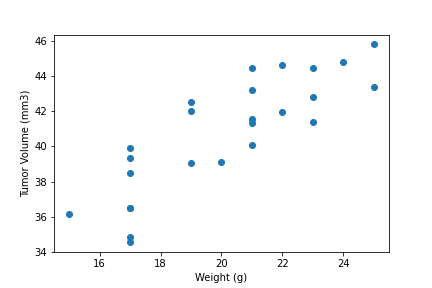
The above scatter plot displays the average tumor volume versus mouse weight for the Capomulin regimen.
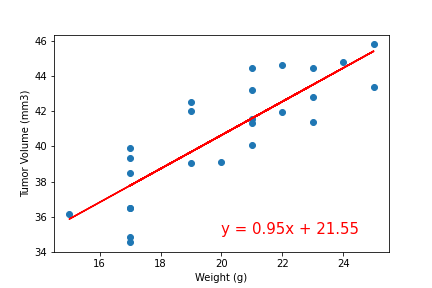
The scatter plot above adds the linear regression for average tumor volume versus mouse weight for the Capomulin regimen. To predict the average tumor volume (y), enter mouse weight as the x-value.