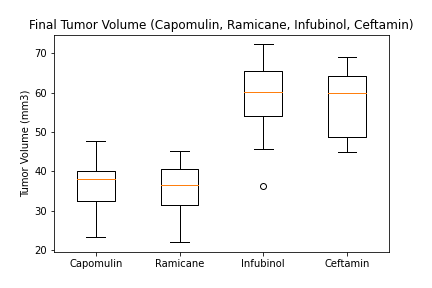
The boxplot makes it easy to see the final tumor volume mean, lower and upper quartiles, and the range. In the case of Infubinol, you can see that there is one outlier. The final tumor volume only accounts for the last record of measurement of the tumor for each mouse.